







Best Attack Surface Visualization Tools
August 24, 2026
3 min read

Pinpointing the attack surface is vital for defensive and offensive cybersecurity teams alike. Undoubtedly, visual mapping outshines simple lists. Experts quickly grasp entity connections, spotting opportunities and threats. Specialists leverage the visual format to craft optimal plans, maximizing efficiency and insight.
This article offers top tools to help you visualize an attack surface.
Do we need to visualize attack surfaces?
Visualizing the attack surface serves multiple purposes. It helps pentesters better understand asset interconnections during attack planning. Internal security specialists can focus on protection by visual categorization of assets. For global organizations, geographical mapping reveals location-specific vulnerabilities. Organizational unit mapping enables targeted resource allocation based on departmental risk profiles.
Analysis becomes more accurate with visual representation. By seeing interconnections in the attack surface, security pros can better find and fix vulnerabilities. This leads to better attack surface management.

This is the second version of this article, updated in 2026. We review popular tools for visualizing the attack surface and explain when each one is best suited.
Best All-in-One Tool: Netlas
Netlas.io stands out as one of the premier Internet search engines. It enables users to retrieve comprehensive information about desired hosts. This includes WHOIS and DNS records, scanning results, TLS certificates, and more. Users can combine all data into an intuitive graph. It allows for quick searches across any node.
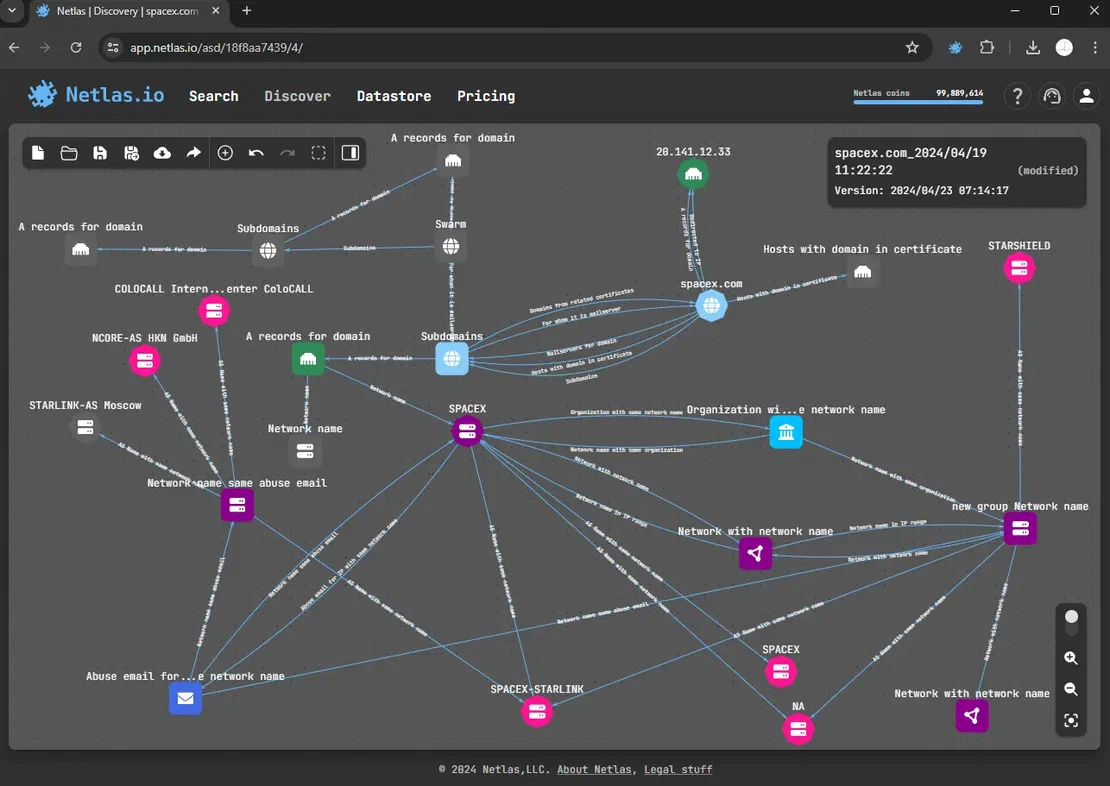
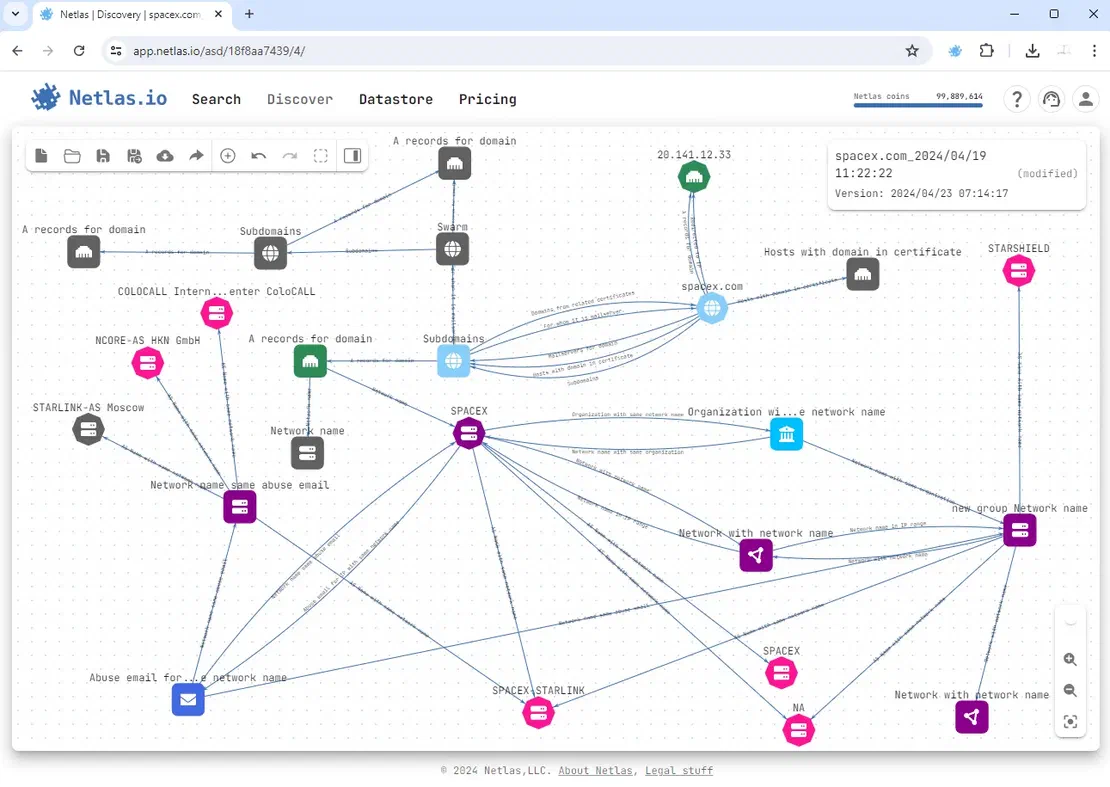
To create such a surface, you’ll first need to register. After account activation, log in and navigate to the Discover tab.
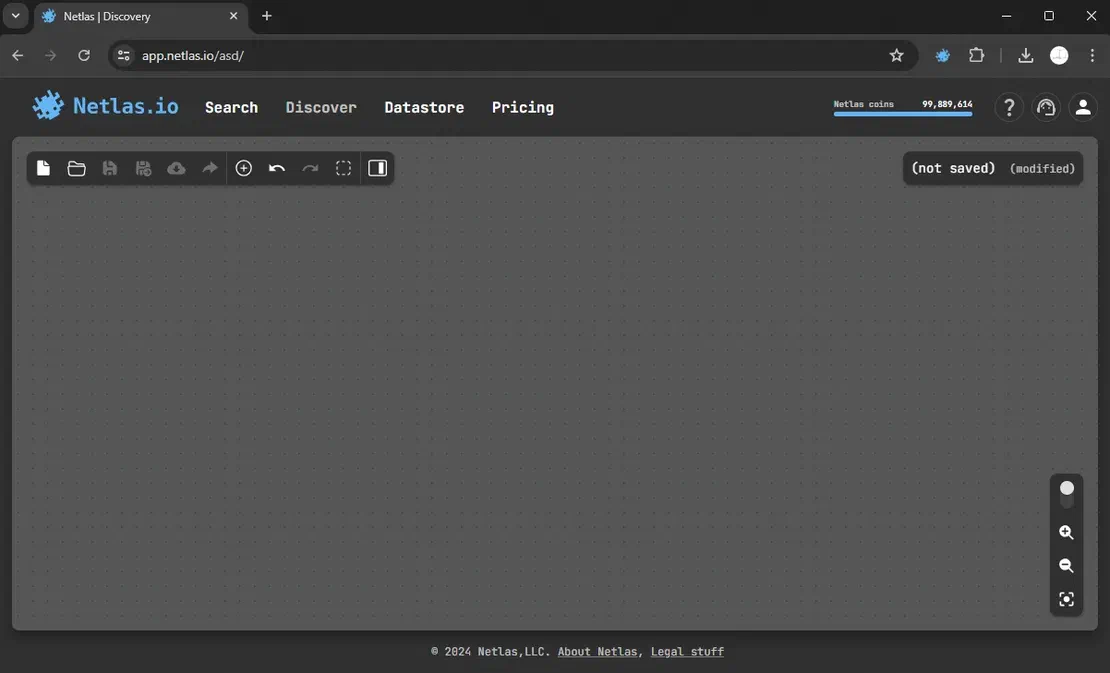
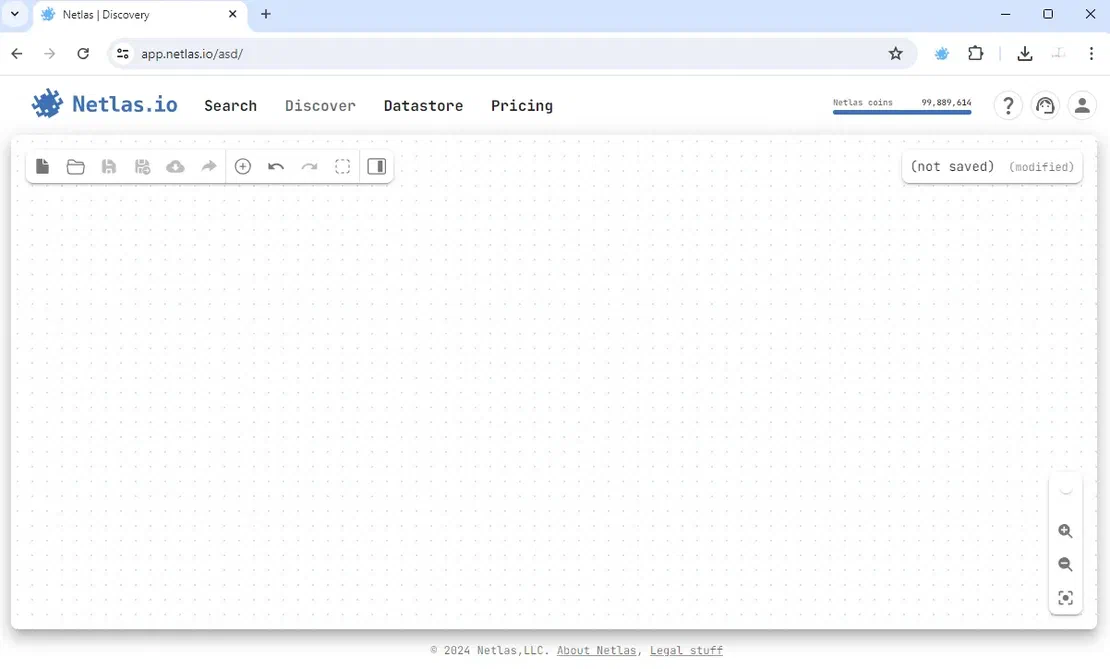
After adding a starting node, click on it to reveal all available search options.
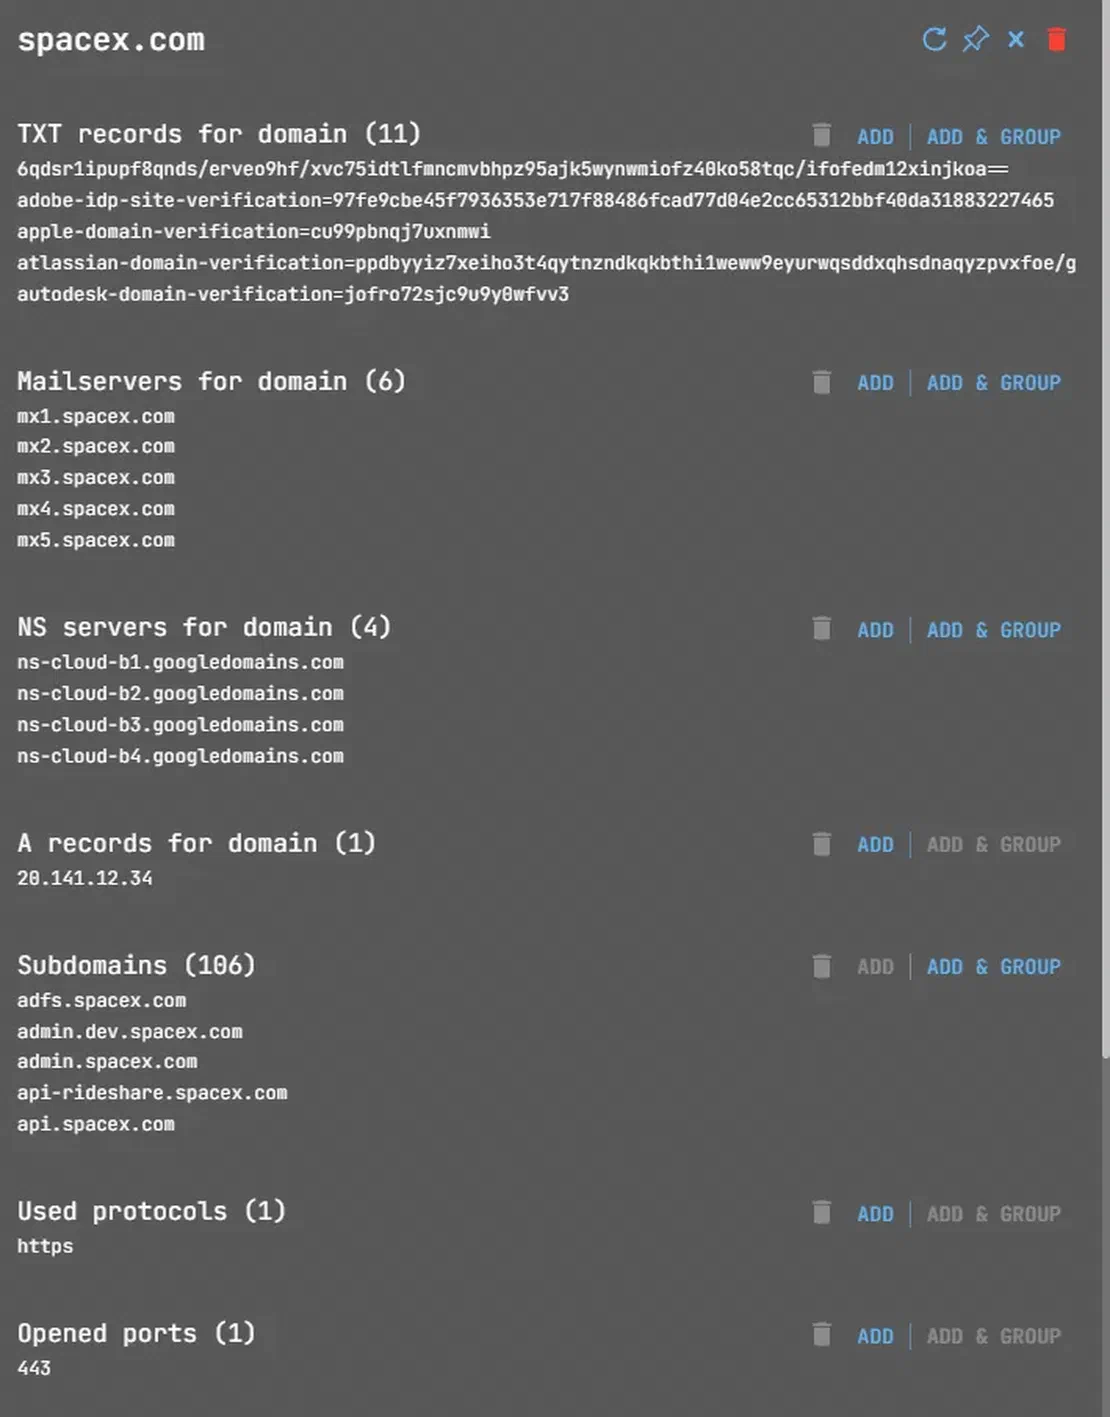
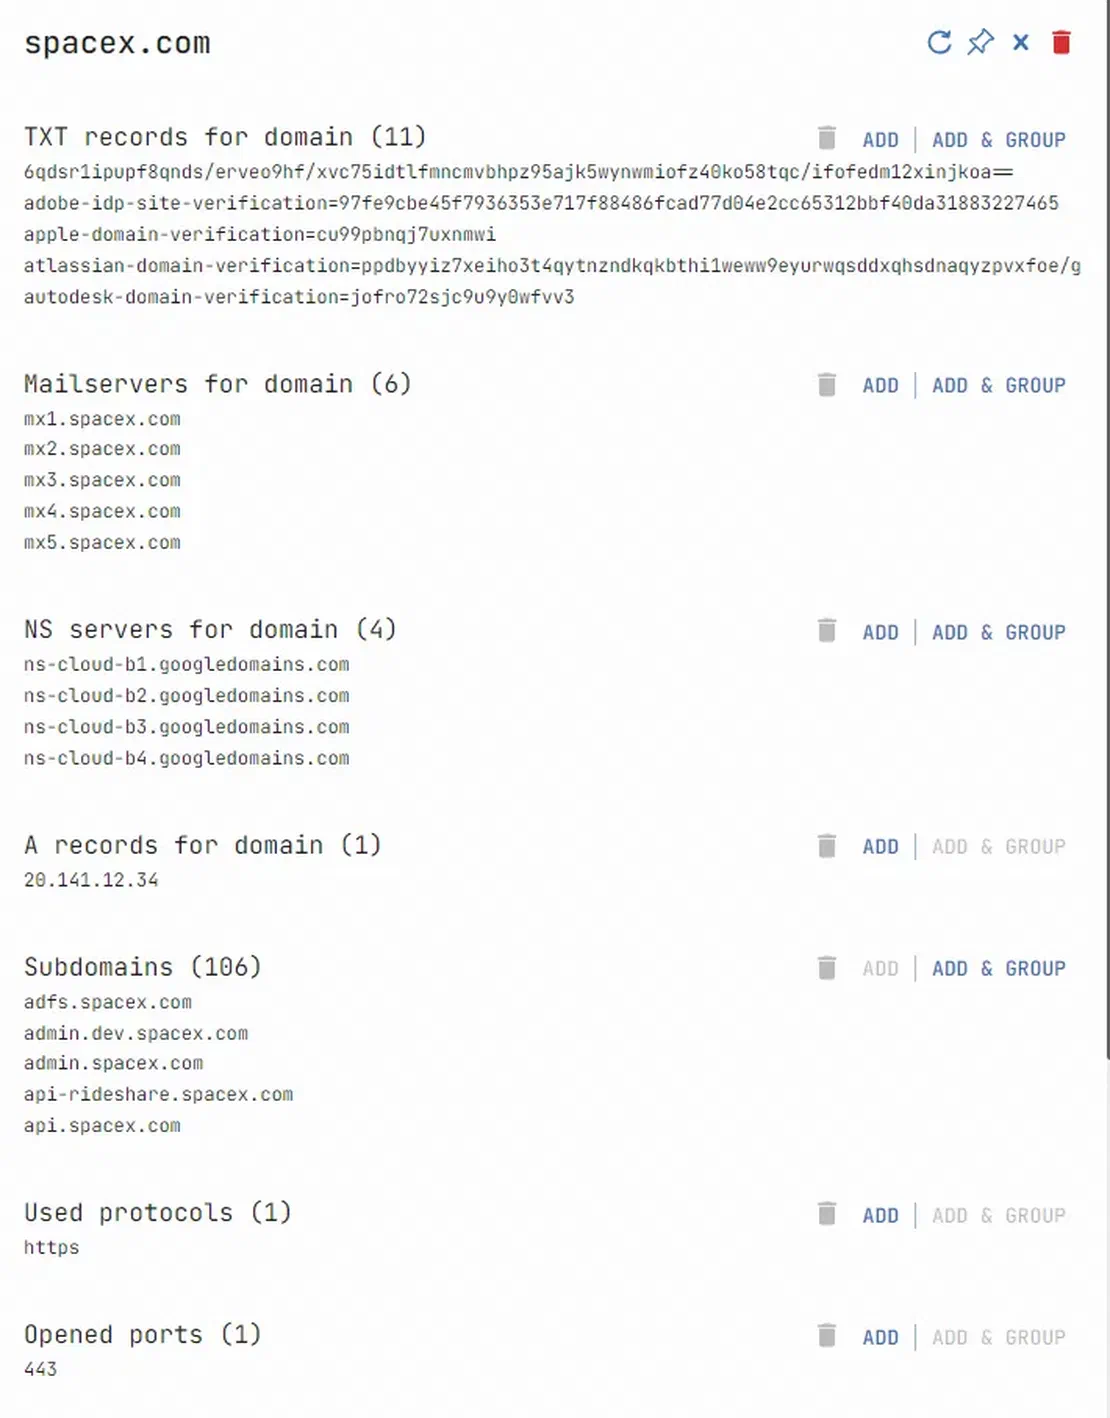
Selecting a search option allows you to add corresponding objects to the graph. Multiple results prompt individual or grouped additions. For more detailed information, refer to this help article.
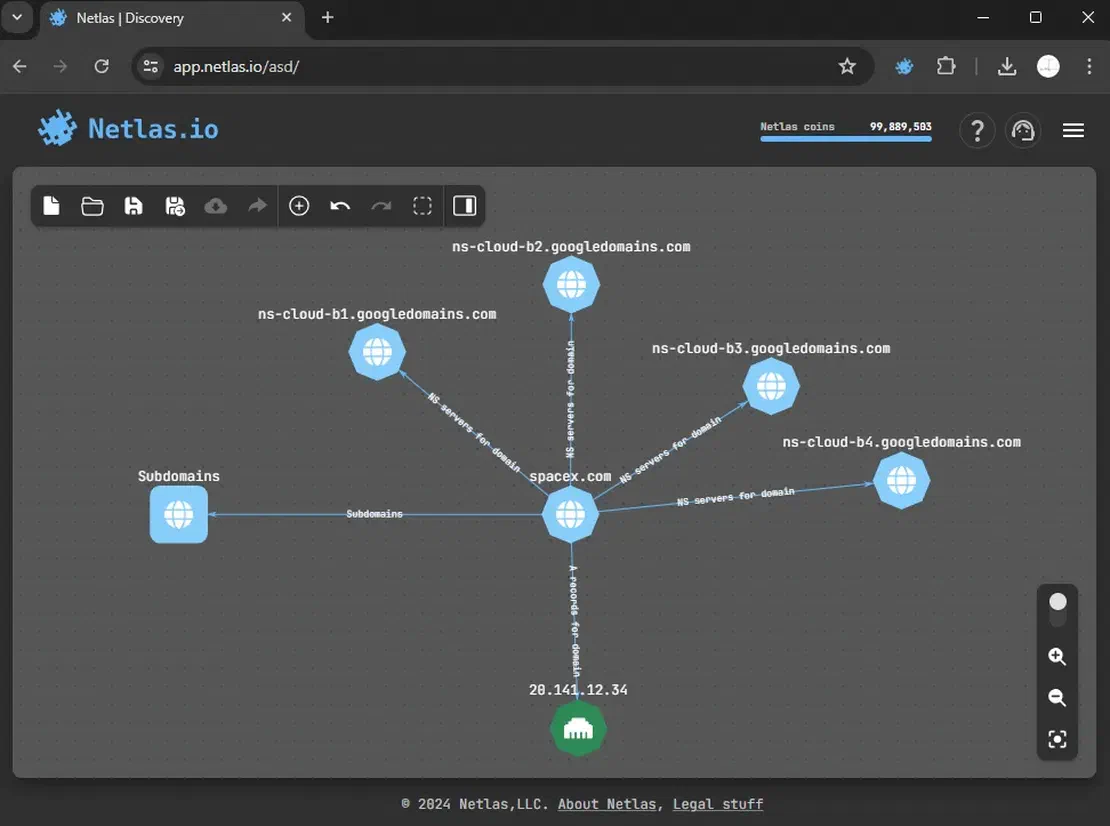
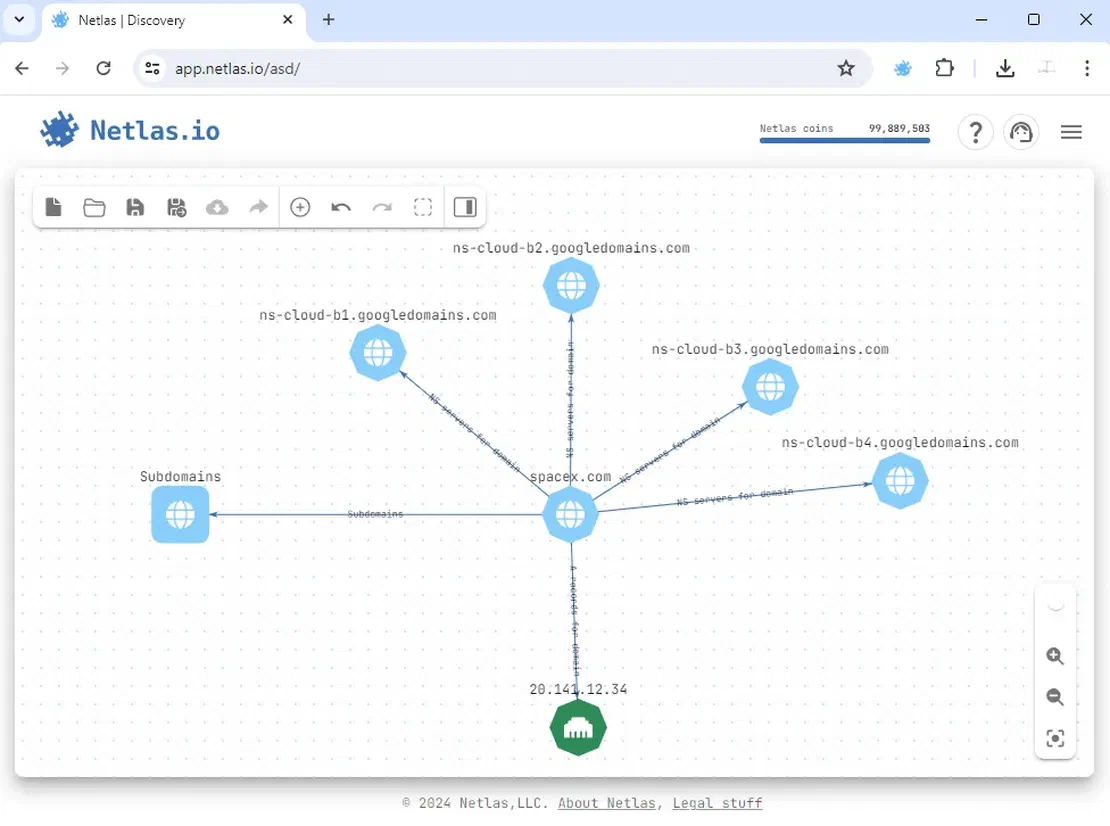
Netlas is integrated into several tools, like Maltego and OWASP Amass. This integration lets you use Netlas’s results as extra data in these popular tools.
Best Enterprise Tool: Maltego
This powerhouse application transforms raw data into actionable intelligence. By tapping into over 100 official sources and countless unofficial ones, Maltego builds a comprehensive web around any target. Users convert objects with ease, recognizing subtle relationships. For pre-penetration reconnaissance and outcome analysis, Maltego’s unrivaled capabilities make it the go-to choice for savvy investigators.
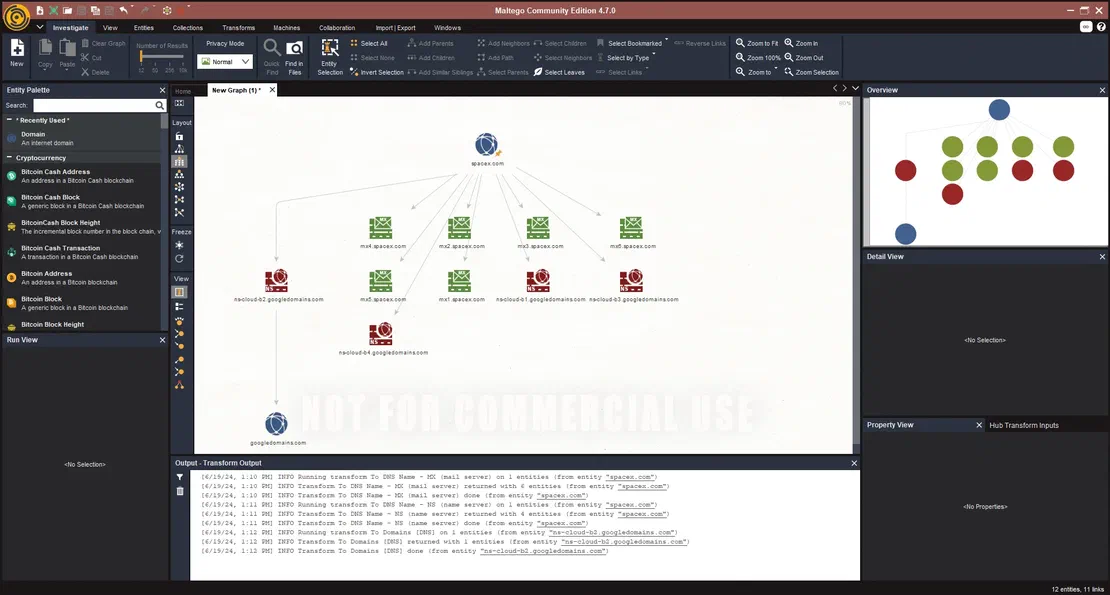
Price proves to be the main obstacle. While a free version exists, it caps graphs at twelve objects. Full functionality demands payment, with some data sources costing extra. Despite its capabilities, the app’s cost structure may deter many potential users.
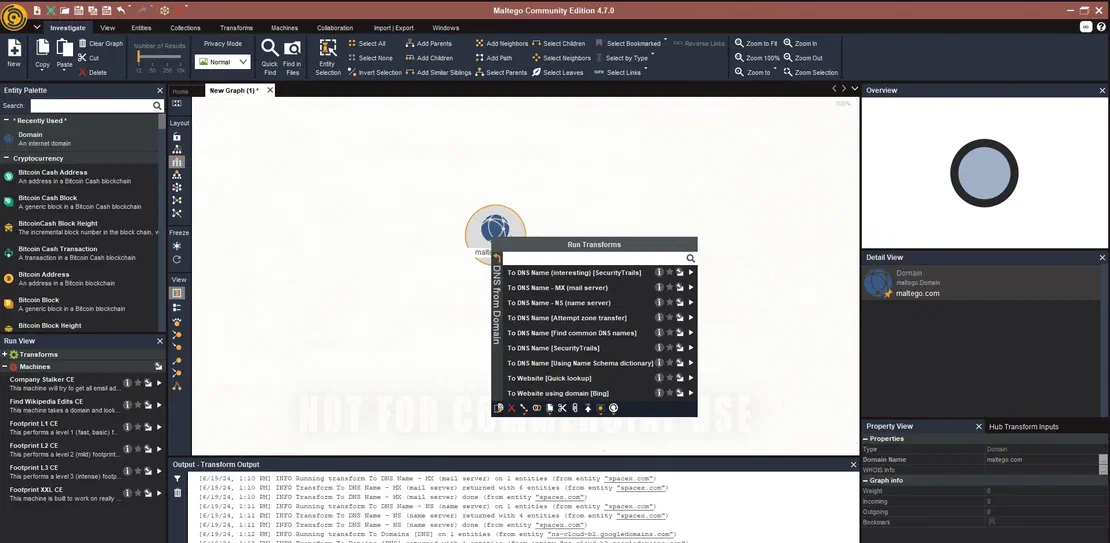
To begin using Maltego, download the application from its official website and create an account at https://www.maltego.com/. Once installed, open the application and add the desired data sources.
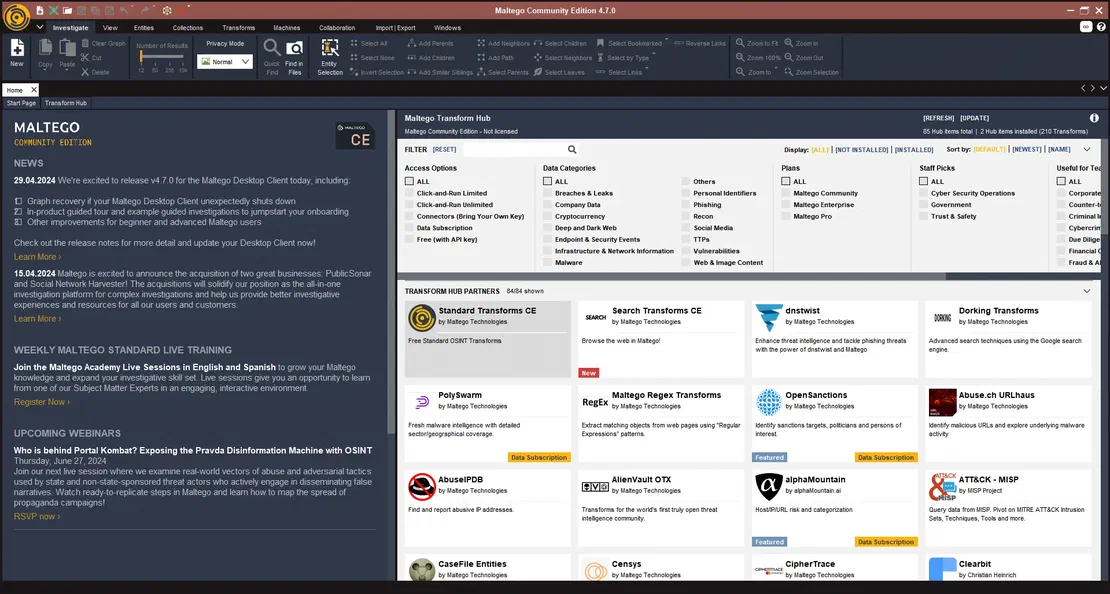
Lastly, create a new workspace. Navigate to the Entity Palette tab, choose the object of your interest, and begin establishing transformations from there.
Best Open Source Tool: OWASP Amass
Amass is a reconnaissance tool that simplifies building an attack surface with a single command. Unlike manual object placement, all you need is the root domain and a few specified flags for settings.
OWASP Amass operates as an open-source project, meaning it’s entirely free to use. To begin using Amass, you’ll need both the tool itself and auxiliary utilities called OAM Tools. Follow the instructions provided in the official project repository.
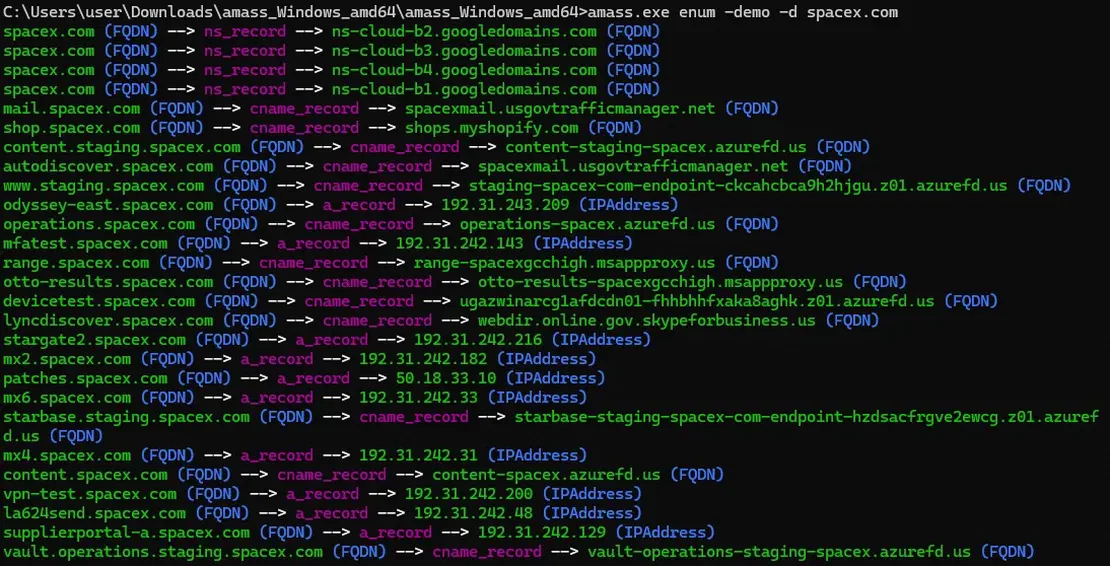
Once you set everything up, run a simple command to create an attack surface using the Amass tool:
amass enum -d yourTargetHere’s the output you can expect (I used the demo version for privacy reasons):
After installing OAM Tools, use the oam viz tool by entering the following command:
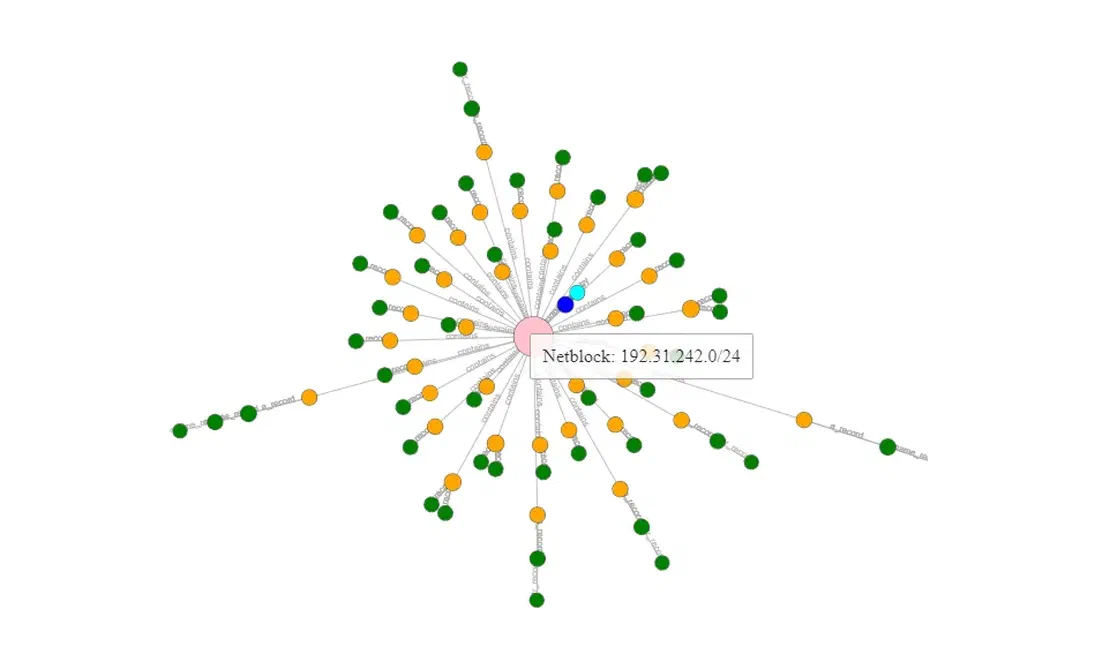
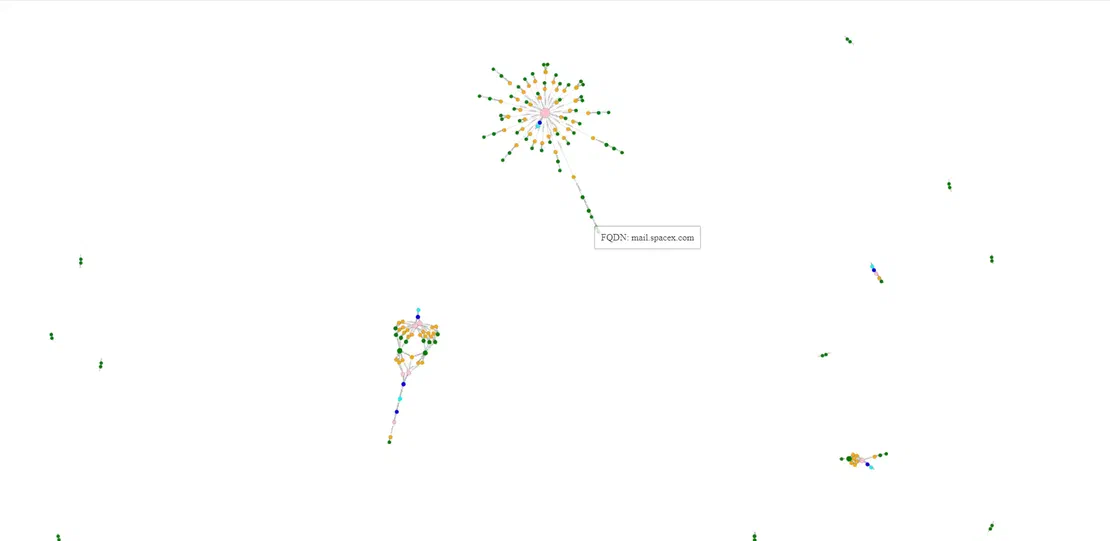
oam_viz -d3 -d yourTargetInstead of using the -d3 flag, you can opt for a different rendering flag that suits your requirements. In this case, choosing that flag will create an .html file in your output folder. Opening this file will display a graph depicting the assembled attack surface.
Summary
Netlas.io, Maltego, XM Cyber, and OWASP Amass offer distinct approaches to attack-surface visualization. Netlas excels at consolidating tools and data, although it relies on proprietary sources. Maltego provides comprehensive enterprise-grade analysis, but its pricing and interface may not suit every team. XM Cyber helps large organizations prioritize remediation by modeling validated attack paths across hybrid environments. OWASP Amass is a strong option for teams that prefer an open-source reconnaissance workflow.
Previous versions of this article also mentioned SpiderFoot. The project was acquired in 2022. Its open-source repository remains publicly available, but the latest upstream commits date to late 2023. Consider this limited recent maintenance when choosing a tool for a new workflow.
Each tool has strengths that suit different cybersecurity needs. Choose based on your organization’s requirements, environment, and available resources.

I can show you how deep the Internet really goes
Discover exposed assets, infrastructure links, and threat surfaces across the global Internet.
Related Posts

October 9, 2024
Complete Guide on Attack Surface Discovery

August 6, 2025
The $1.5B Bybit Hack & How OSINT Led to Its Attribution

July 25, 2025
The Pyramid of Pain: Beyond the Basics

June 8, 2025
Best Honeypots for Detecting Network Threats

July 20, 2025
An Expert’s View on DNSSEC: Pros, Cons, and When to Implement

October 3, 2025
Post-Quantum Now: From AES & RSA to ML-KEM Hybrids