


Discovering Data Exposure with Netlas
May 21, 2026
20 min read

A developer creates an application, launches it in production, and uploads the code to GitHub. Everything seems to work: endpoints respond, the UI loads, and there are no clear issues. It’s easy to assume that if nothing is broken, nothing is exposed. However, just one mistake, like a misplaced configuration file, an exposed debug endpoint, a public .env file, or a detailed HTTP response, can quietly leak sensitive data to the internet.
These exposures might seem easy to spot at first, but in reality, they are not. The real challenge is figuring out what sensitive data to look for and where to find it, especially when working at scale.
1. Understanding Data Exposure
Modern applications often expose both internal context and private secrets through the same surfaces: HTTP responses, debug pages, configuration artifacts, and API documentation. Small deployment mistakes can turn these surfaces into searchable exposures at internet scale.
1.1. Internal vs Private Data in Modern Applications
According to the OWASP Top 10:2025, categories such as Security Misconfiguration and Authentication Failures highlight how exposed application components can lead to data disclosure.
From a practical system design perspective, exposed data in this context can be grouped into two broad categories:
- Internal Data/Configuration Data / System Information
- API routes
- service endpoints
- debug flags
- OpenAPI/Swagger documentation
- Private Data/Sensitive Data (Secrets / Credentials)
- API keys
- database access credentials
- bearer tokens
- cloud access secrets
| Data Type | Examples | Direct Impact | When Indexed |
|---|---|---|---|
| Internal | /api/v1/internal, Swagger docs, debug flags | Low-Moderate | High (context amplification) |
| Private | sk-xxxx, DB URIs, JWT tokens | Critical | Severe (immediate abuse) |
1.2. Why Misconfigurations Are the Primary Cause
Misconfigurations are the main reason data gets exposed. They happen when there’s a difference between how an application is built and how it’s actually deployed. These issues can show up during:
- deployment
- environment setup
- infrastructure configuration
- integration with external services
and they commonly remain unnoticed because the application keeps working as expected.
| Scenario | What Happens | Result |
|---|---|---|
| Extra data in API response | Unfiltered output | Information disclosure |
| Publicly accessible configs | Data served over HTTP | Direct exposure |
| Missing restrictions | Open endpoints | Unintended access |
| Dev settings in production | Debug/system data visible | Increased visibility |
Misconfigurations happen often, not because they are complicated, but because they are easy to make and hard to spot. Here’s why they are difficult to detect:
- They do not interrupt the application flow.
- They often pass the testing environments.
- They are spread across multiple systems.
- They are introduced through rapid deployments.
Misconfigurations are even more serious when viewed from the outside. Tools like Netlas collect HTTP responses from public systems, making these issues easier to spot.
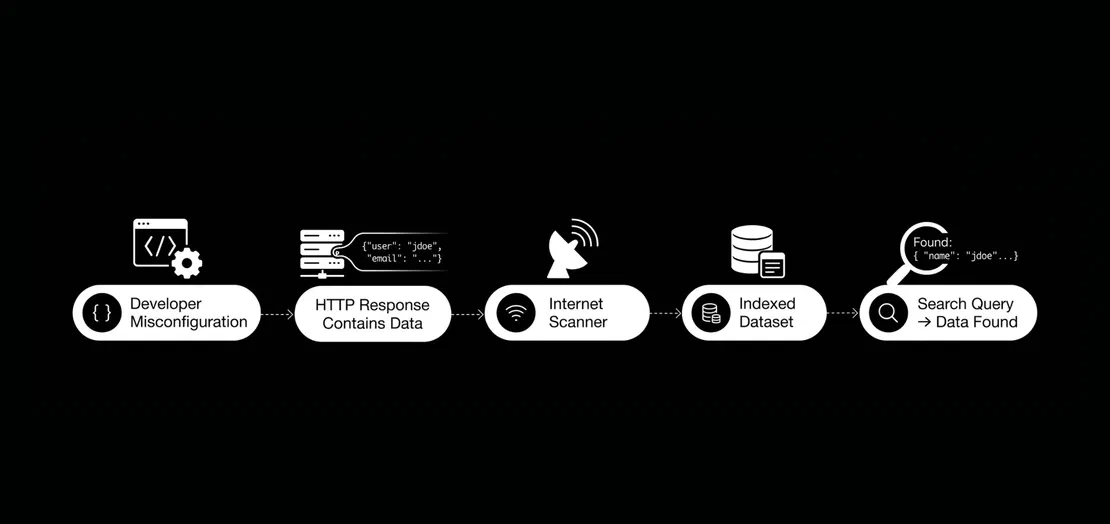
Misconfigurations lead to discoverability by a simple flow of actions: Misconfiguration → Application Response → External Visibility → Aggregation → Pattern Recognition
But where do these exposures commonly occur?
2. Common Sources of Exposure in Web Applications
In modern applications, data exposure usually doesn’t come from just one problem. It often happens at different points in the application stack where data is created, stored, or sent back.
Netlas helps find these patterns at scale. Let’s look at the most common sources of these exposures.
2.1. .Environment Files and Configuration Artifacts
The .env file is a standard way to separate application configuration from code. Modern web frameworks such as Laravel, Symfony, Node.js (via dotenv), and Django also use .env files.
Environment files are plain text, so they’re a big risk if exposed. A typical .env file uses a simple key-value format:
APP_ENV=production

AWS_ACCESS_KEY_ID=AKIAEXAMPLE
AWS_SECRET_ACCESS_KEY=secretkeyexample

STRIPE_SECRET_KEY=sk_live_xxx
SENDGRID_API_KEY=SG.xxxxxx

MAIL_USERNAME=user123
MAIL_PASSWORD=pass123A single .env file can expose:
- cloud infrastructure access
- credentials for the payment gateway
- email service authentication
- application-level secrets
The real issue happens during the deployment and setup of the web app. If a web server is misconfigured, it might serve the .env file as a static file. If a PHP framework is in debug mode and encounters an unhandled error, it might display the entire process environment, including all .env variables, on an HTML error page. In frameworks like Laravel, enabling debug mode (APP_DEBUG=true) can cause unhandled errors to display full error pages that reveal the entire application environment.
Here’s an example of a publicly exposed Laravel environment dump. In this case, the application returns its runtime configuration, including values from the .env file. Netlas found this exposure by searching for HTTP responses with Laravel-specific environment variable patterns, such as APP_KEY, DB_HOST, and APP_ENV.
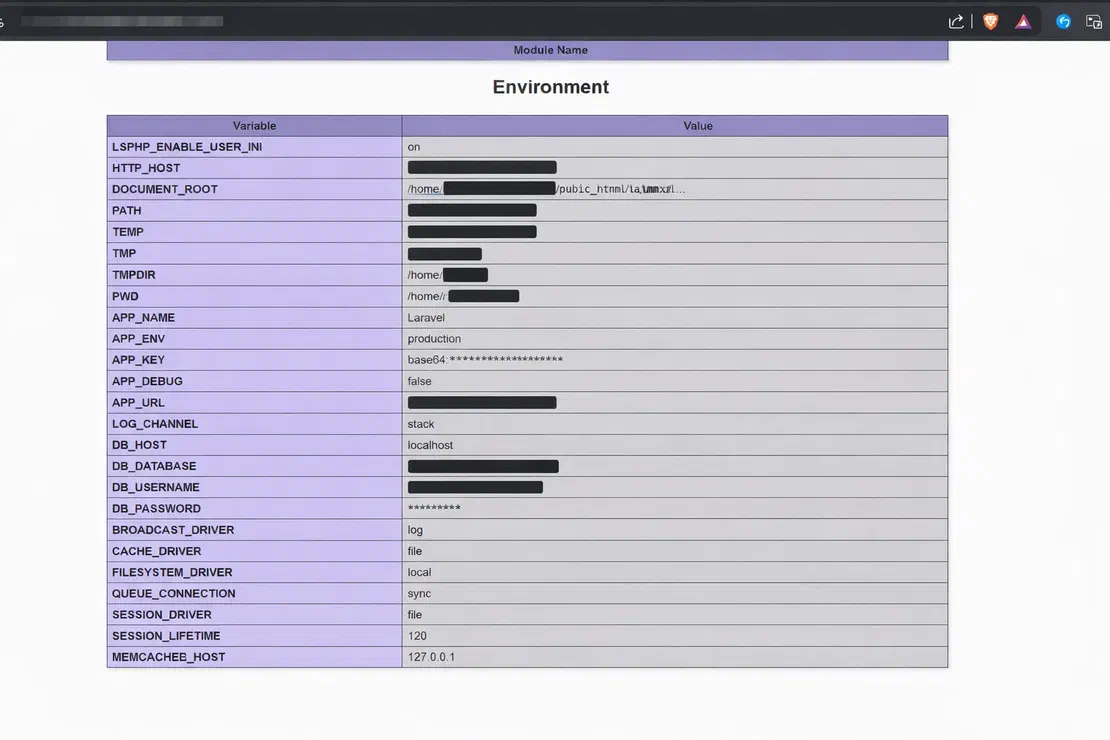
This result was found in Netlas using the query:
http.body:"APP_ENV=production" AND http.body:"APP_KEY="Request Your Free 14-Day Trial
Submit a request to try Netlas free for 14 days with full access to all features.
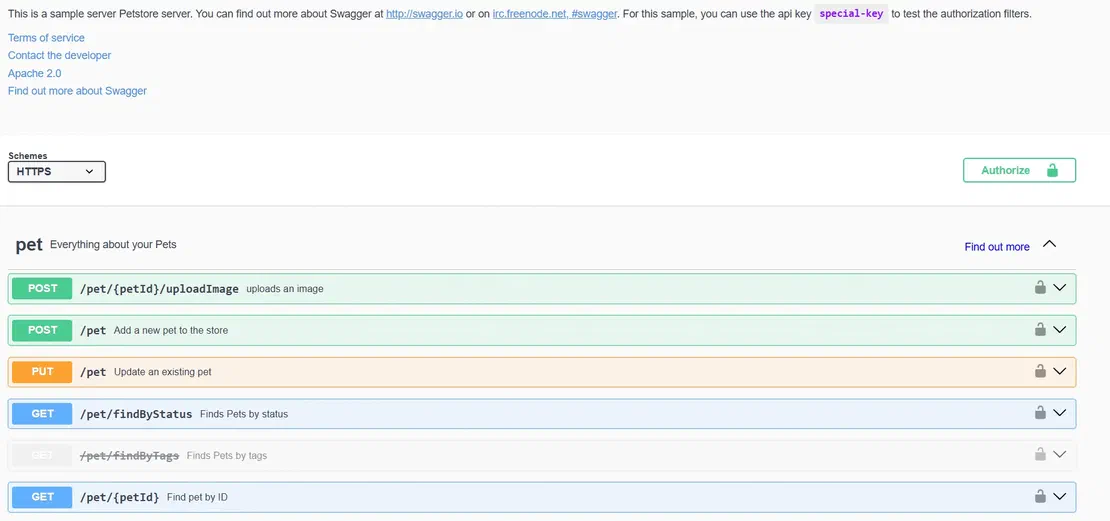
2.2. Swagger UI and API Documentation Endpoints
Swagger UI is a documentation interface created from OpenAPI specifications. These interfaces are meant to make development and integration easier.
Frameworks and tools commonly expose these interfaces at paths like:
/swagger/docs/api-docs/openapi.json
Swagger UI is more than just documentation. It’s a live interface to the API. If it’s open to the public, it can reveal:
- available endpoints, including internal ones
- request/response structures
- authentication mechanisms
- hidden or undocumented routes
Swagger UI and OpenAPI specs leave clear patterns in HTTP responses, which Netlas captures and makes searchable. You can usually identify Swagger in Netlas by looking for:
- HTML interfaces containing
swagger-ui - JSON responses with
openapiorswaggerfields - API schemas listing
paths,components, andschemas
For example, an indexed response may contain:
{
  "openapi": "3.0.0",
  "paths": {
    "/api/v1/users": {},
    "/api/v1/admin": {},
    "/internal/debug": {}
  }
}The main security risk with Swagger is that it gives attackers the details they need to interact with the API.
swagger-ui flaw, it reinforces the same operational point: publicly accessible Swagger and OpenAPI endpoints expand attack surface and should be patched promptly, restricted where possible, and continuously reviewed as part of attack-surface management.2.3. Debug Endpoints and Development Settings
Debug endpoints and development settings help developers during testing, but if they stay enabled in production, they can become a major source of exposure. In Django, it appears as a settings table rendered on the error page HTML, whereas in Laravel, it is a $_SERVER superglobal dump.
For example, a typical debug response may look like this:
Exception: Database connection failed

Trace:
#0 /var/www/app/database.php(42)
#1 /var/www/app/index.php(10)

ENV:
APP_ENV=production
APP_DEBUG=true
DB_USERNAME=root
DB_PASSWORD=rootThis kind of response combines:
- system structure, like file paths
- configuration data
- sensitive credentials, such as database access credentials
Typical indicators include:
APP_DEBUG=trueExceptionorStack traceTraceback (most recent call last)- file paths like
/var/www/or/app/
Example queries:
http.body:"APP_DEBUG=true"http.body:"Exception" AND http.body:"Stack trace"http.body:"Traceback (most recent call last)"These queries help identify applications running in debug mode, exposed error pages, and responses that are leaking internal system details. These sources include configuration files, API documentation, and debug outputs. When misconfigured, these sources together reveal how an application is built, set up, and run.
3. Types of Sensitive Data Commonly Exposed
Here are the main types of sensitive data found in indexed HTTP responses. Each type comes with its own risks.
3.1. API Keys and Third-Party Integrations
API keys are a common way for apps to authenticate with external services. Most apps today depend on third-party integrations for things like mapping (Google Maps), cloud services (AWS, Google Cloud), payments (Stripe, PayPal), communication (Twilio, SendGrid), and analytics (Firebase, Mixpanel).
API keys allow services to authenticate requests, track usage and billing, and enforce rate limits. API keys are usually sent within:
- HTTP headers
- query parameters
- request bodies
API keys for third-party services may appear in HTTP responses depending on how integrations are handled. These keys might be exposed through plugin configurations in CMS HTML output, initialization code in frontend JavaScript, or inline script tags that load third-party services.
For example:
GET /v1/customers HTTP/1.1
Authorization: Bearer sk_live_xxxxxor:
GET /maps/api/geocode/json?key=AIzaSyXXXXAPI keys are usually kept in .env files, backend settings, and sometimes in frontend code for public APIs.

API keys have a predictable format, which makes them easy to spot.
| Service | Key Prefix / Pattern | Example Pattern | Risk if Unrestricted |
|---|---|---|---|
| AWS | AKIA + 16 chars | AKIAxxxxxxxxxxxx | Cloud resource access, billing |
| Stripe | sk_live_ / sk_test_ | sk_live_xxxxxxxxx | Payment processing, customer data |
| Google APIs | AIzaSy + 33 chars | AIzaSyxxxxxxxxxxxxx | Quota abuse, billing, data access |
| GitHub | ghp_ / gho_ | ghp_xxxxxxxxxxxxx | Repository access, code exfil |
| SendGrid | SG. + token | SG.xxxxxxxxxxxxx | Email abuse, phishing |
How API Keys Appear in Application Responses
- Environment files.
AWS_ACCESS_KEY_ID=AKIAIOSFODNN7EXAMPLE
STRIPE_SECRET_KEY=sk_live_51Hxxxxxx
SENDGRID_API_KEY=SG.xxxxxx
GOOGLE_API_KEY=AIzaSyXXXXXX- Directly in responses or frontend code.
const config = {
  apiKey: "AIzaSyXXXXXX",
  authDomain: "example.firebaseapp.com"
};or
<script src="https://maps.googleapis.com/maps/api/js?key=AIzaSyXXXX"></script>Discovering API Keys Using Netlas
Because API keys follow uniform patterns, they can be identified using response-based queries in Netlas. The most generic query for API detection is:
http.body:"api_key="AWS access key prefix:
http.body:"AKIA"Stripe live key:
http.body:"sk_live_"Google API key prefix:
http.body:"AIzaSy"SendGrid API key prefix:
http.body:"SG."In practice, finding API keys is less about using complex methods and more about knowing the patterns and searching for them effectively.
3.2. Database Access Credentials and Service Configurations
Database access credentials are the most serious type of direct exposure. A full set includes the host, port, database name, username, and password: everything needed to connect if the database is reachable. These credentials are easy to detect.
Typical Exposed Database Credential Block
DB_CONNECTION=mysql

DB_HOST=127.0.0.1

DB_PORT=3306

DB_DATABASE=production_db

DB_USERNAME=admin

DB_PASSWORD=*******

# cloud hosted example

DB_HOST=rm-bp17l3o*******39.mysql.rds.aliyuncs.comThese credentials are commonly found in .env configuration dumps, PHP debug pages that expose the $_SERVER superglobal, and framework error pages. In addition to .env variables, credentials also appear in connection URIs:
mongodb+srv://user:[email protected]/dbnamepostgres://user:password@localhost:5432/dbnameThese URI formats pack all connection details into one string, making them easy to identify.
Discovering Database Access Credentials Using Netlas

Because database credentials follow a set format, pattern-based queries in Netlas can detect them. A highly effective approach is to search for individual configuration variables:
http.body:"DB_USERNAME="http.body:"DB_PASSWORD="Here are some of the most common database configuration patterns that can be used for detection.
RDS (cloud-hosted database):
http.body:"DB_HOST" AND http.body:".rds.aliyuncs.com"MongoDB connection string:
http.body:"mongodb+srv"PostgreSQL connection URI:
http.body:"postgres://"These queries find results when database usernames or passwords are present. Using them alone can give noisy results, so combining queries helps reduce false positives.
To increase precision, multiple indicators can be combined within a single query:
http.body:"DB_USERNAME=" AND http.body:"DB_PASSWORD="3.3. Bearer Tokens and Authentication Artifacts
Bearer tokens, like JSON Web Tokens (JWTs), are commonly used for API authentication. The bearer scheme (RFC 6750) lets tokens be included in HTTP authorization headers. If these tokens are in frontend JavaScript, they are directly visible.
An exposed JWT can’t be used to make new tokens, but an attacker can use it to make authenticated requests as long as it’s still valid and not revoked.
JWTs follow a fixed format:
header.payload.signatureThe payload is usually in base64, so exposed tokens can be decoded to show:
- subject identity
- issued-at and expiry timestamps
- custom claims
Discovery Queries
http.body:"Authorization: Bearer"http.body:"Bearer eyJ"host:"yourdomain.com" AND http.body:"Bearer eyJ"Infrastructure Indicators (Related Artifacts)
In some cases, authentication artifacts appear alongside configuration indicators such as:
AWS_ACCESS_KEY_IDALIBABA_SMS_ACCESS_KEY_ID- cloud service endpoints
4. Exposure Visibility Through HTTP Response Indexing
Understanding how large-scale scanning tools like Netlas collect, store, and index HTTP response data explains why these exposures can be discovered through targeted queries.
4.1. How HTTP Responses Are Collected at Scale
Netlas constantly scans internet-facing hosts across the IPv4 space and keeps lists of domains. For each open host and port, it sends HTTPS requests and records the full response: status codes, headers, and body. This data is then indexed and made searchable with structured queries.
Netlas doesn’t target specific apps. Instead, it scans all internet-facing assets broadly and continuously. This involves:
- sending HTTP/HTTPS requests to accessible hosts that are public
- collecting the returned responses
- storing both metadata and full response content
Netlas doesn’t look for specific vulnerabilities or cause error pages. It works within legal and ethical limits by making standard HTTP or HTTPS requests to public URLs, saving the responses, and indexing the content. It doesn’t try to exploit weaknesses or access protected resources. This ensures all data is collected responsibly and keeps trust in the platform for research and security monitoring.

Book Your Netlas Demo
Chat with our team to explore how the Netlas platform can support your security research and threat analysis.
4.2. Data Captured: Headers, Bodies, and Embedded Content
The data Netlas indexes includes several parts of the HTTP response, and each part can contain sensitive information such as:
- Response headers: these reveal server details, authentication schemes, and framework indicators.
- Response body (
HTML,JSON, or plain text): contains things like rendered pages, API responses, or raw configuration data. - Embedded content: includes inline JavaScript and data structures that often reference keys, tokens, or internal endpoints.
Core Search Interfaces
| Field | What It Targets | Example Use |
|---|---|---|
http.body | Full response content | Credentials, tokens, debug output |
http.title | Page title | Swagger UI, directory listings |
http.headers | Response headers | Server info, auth mechanisms |
uri | Request path | .env, /debug, /api-docs |
geo.country | Location metadata | Region-specific filtering |
http.status_code | Response status | Filter valid responses |
5. Discovering Exposure Using Netlas
In the previous section, we established the types of exposure, query structures, and detection strategies. Now, we will focus on practical application and demonstrate how these queries translate into real-life findings.
5.1. Querying HTTP Response Data
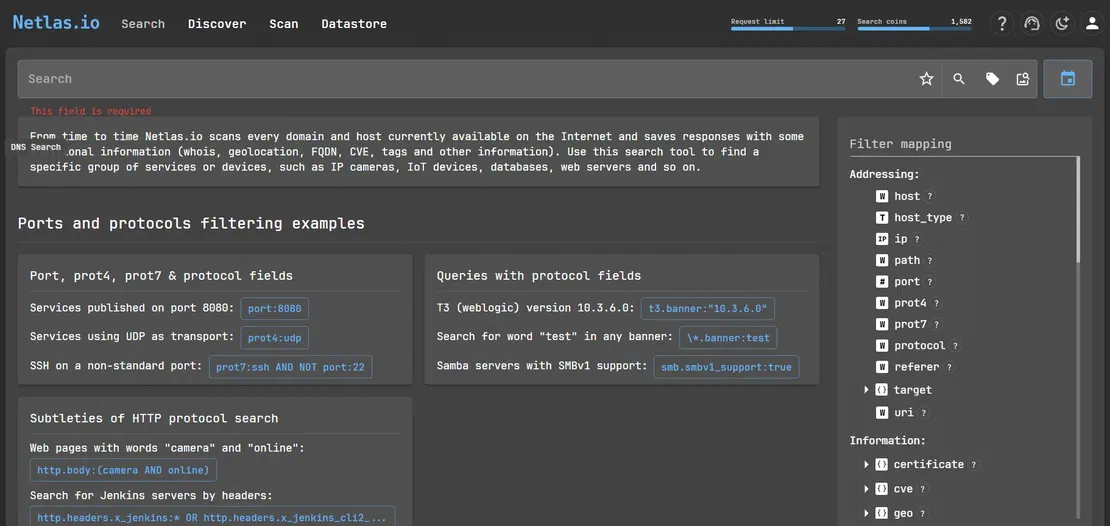
The main way to find exposures in Netlas is by running full-text searches across indexed HTTP responses.
At its core, querying in Netlas is pattern-driven. Simple queries can be constructed using individual terms:
http.body:"api_key="But single-term searches often return a lot of noise and broad results. That’s why we use queries with multiple conditions, like AND, OR, and NOT.
http.body:"DB_USERNAME=" AND http.body:"DB_PASSWORD="Beyond HTTP: Filter-Based Querying
While HTTP content provides the initial signal, Netlas allows deeper filtering across structured fields in metadata and infrastructure layers.
- Search responses of a specific IP host with
host.
host:8.8.8.8- Search responses of a specific domain host with
host.
host:dns.google- Find IP-hosted web services by combining
host_typeandhttp.status_code.
host_type:ip AND http.status_code:200- Search for a specific service endpoint with
uri.
uri:"https://google.com:443/"- Use a regex-based
uriquery for endpoint pattern matching.
uri:/http:\/\/.*\/login/- Search responses for a specific domain.
host:paypal.com- Filter results by IP range with CIDR notation.
ip:"1.1.1.0/24"- Detect redirects with
http.headers.location.
http.headers.location:/.*login.*/- Exclude redirects by combining host, protocol, and status-code filters.
host:mail.* AND protocol:http AND NOT http.status_code:(301 OR 302)- Identify technology with
tag.name.
tag.name:nginx- Filter by service category with
tag.category.
tag.category:webmail- Restrict results by country with
geo.country.
geo.country:AU- Filter by infrastructure provider with
isp.
isp:AmazonYou can combine these filters to get better results and cut down on noise.
http.status_code:200 AND http.body:"api_key="geo.country:"US" AND port:443 AND http.body:"Authorization: Bearer"tag.name:nginx AND http.body:"DB_PASSWORD="uri:/http:\/\/.*\/login/ AND http.status_code:2005.2. Pattern-Based Detection Querying
One of the best ways to detect exposures is by using pattern-based compound queries.
Instead of searching for specific hosts, this method looks for types of misconfigurations across all indexed HTTP responses. Netlas is built on an Elasticsearch-style query model, which means detection logic can be constructed using filters, logical operators, wildcards, and even regular expressions.
When you combine noisy signals with structured query logic, you get more accurate detection.
Configuration Exposure (.env / Laravel)
http.body:"APP_ENV=production"This is the basic query that can be used to detect production environment configurations in responses.
http.body:"APP_ENV=production" AND http.body:"DB_PASSWORD=" AND http.body:"MAIL_PASSWORD="Targets full configuration leaks containing multiple sensitive credentials that can exist in a single configuration file.
Debug / Error Page Detection
http.body:"Traceback (most recent call last)"This query can find application error pages that expose Python traceback information.
http.body:"Traceback (most recent call last)" AND http.body:"django"It narrows down the results to only Django-specific debug pages.
http.body:"Traceback (most recent call last)" AND http.body:"META"Can be used to detect Django debug pages that expose full environment variables.
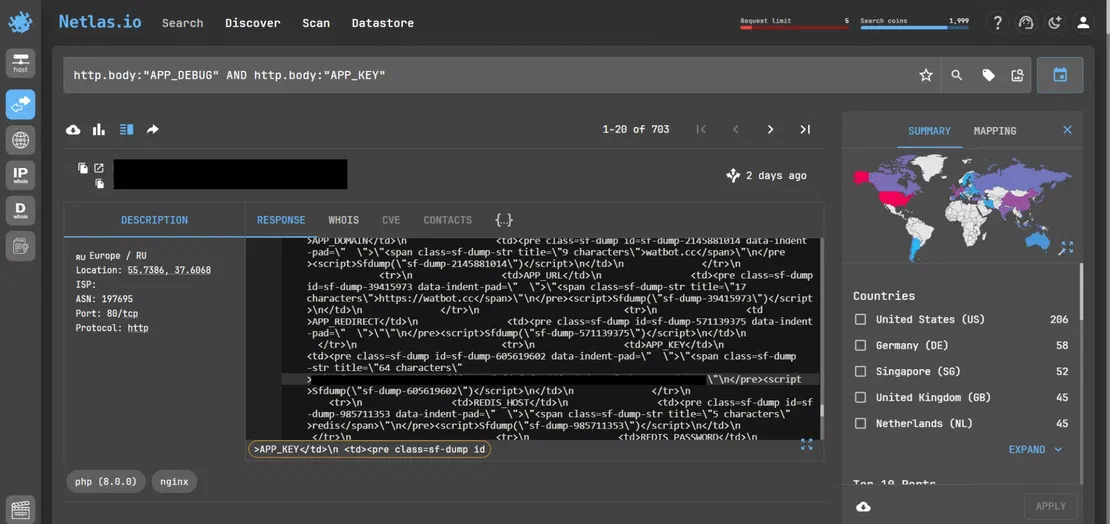
http.body:"APP_DEBUG" AND http.body:"APP_KEY"Can identify debug outputs that are leaking application configuration and keys.
Directory and File Exposure
http.title:"Index of" AND http.body:"backup"Open directory listings containing backup files.
http.body:(".log" OR ".sql" OR ".env")Sensitive file type patterns in indexed responses.
http.title:"Index of" AND http.body:("id_rsa" OR "authorized_keys" OR "ssh_config")Query for identifying SSH and authentication file exposure.
Pattern-based detection moves the focus from finding single leaks to spotting repeatable, system-wide exposure patterns.
5.3. Example Findings
The following findings were identified during the research using queries described above. These findings show that the exposure patterns discussed earlier aren’t just theoretical, they show up regularly in real HTTP response data.
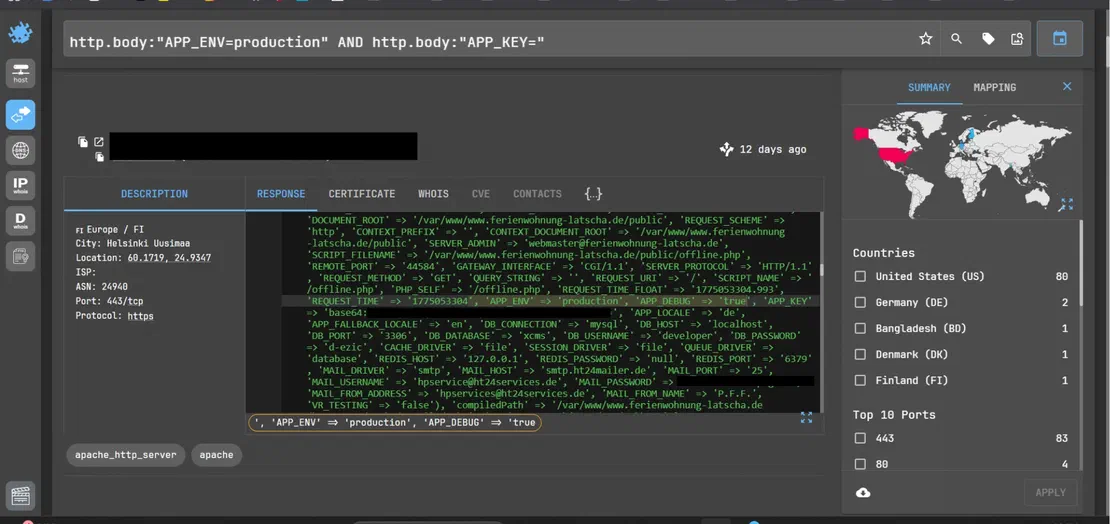
Finding 1 — Exposed .env Configuration (Laravel Production Server)
Query used:
http.body:"APP_ENV=production" AND http.body:"APP_KEY="A production Laravel app was found serving its full runtime environment configuration. The HTTP response contains the application encryption key, database access credentials, SMTP server credentials, and debug mode status. All of these are visible in the response body.
APP_ENV => 'production'
APP_DEBUG => 'true'
APP_KEY => 'base64:sdZ85q********************J4='
DB_CONNECTION => 'mysql'
DB_HOST => 'localhost'
DB_DATABASE => 'xcms'
DB_USERNAME => 'developer'
DB_PASSWORD => '**********'
MAIL_HOST => 'smtp.ht24mailer.de'
MAIL_USERNAME => '[email protected]'Risk: Critical.
APP_KEYexposed: an attacker can forge signed session cookies and decrypt application data, which can enable account takeover.- SMTP credentials live: these can be used immediately to send phishing emails from the victim domain, which may bypass spam filters.
- DB credentials present: direct database access may become achievable via server-side weaknesses such as SSRF, RCE, or file inclusion, since the host is localhost.
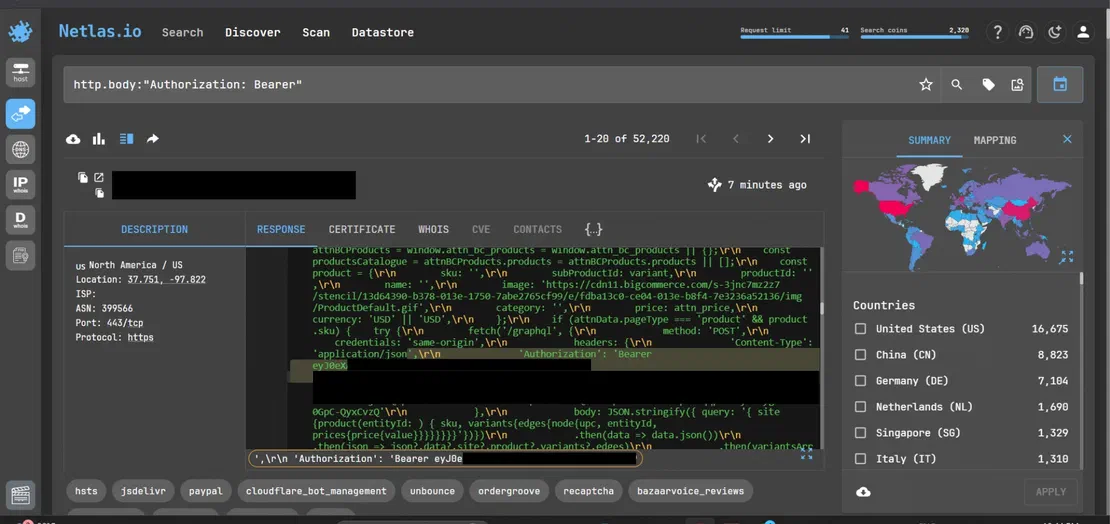
Finding 2 — JWT Bearer Token in Client-Side JavaScript
Query used:
http.body:"Authorization: Bearer"An e-commerce site was found serving a full JWT bearer token hardcoded in inline JavaScript. The token was used to make authenticated GraphQL API calls to retrieve product pricing and variant data. The token is delivered to every user loading the page, which makes it publicly accessible and indexable.
Risk: Medium.
- The token is delivered to every page visitor.
- An attacker can make authenticated API calls as long as the token remains valid or is not revoked.
- GraphQL APIs expose broad data access, and a valid token can allow reading customer data, orders, and pricing rules.
- Enables unauthorized API access, impersonation, and data extraction if the token is valid.
Finding 3 — Symfony VarDumper with APP_KEY and Crypto Contract Addresses
Query:
http.body:"APP_DEBUG" AND http.body:"APP_KEY"A server running a PHP/Symfony application with VarDumper was found publicly serving a full debug dump. The output exposed the application’s encryption key and other configuration values.
$_ENV['APP_KEY']  => 'base64:g0JqQg1w4YjBh***************'
$_ENV['APP_ENV'] => 'production'Risk: High.
Exposing APP_KEY compromises application-level security and can enable session forgery, cookie decryption, and even account takeover, depending on the implementation.
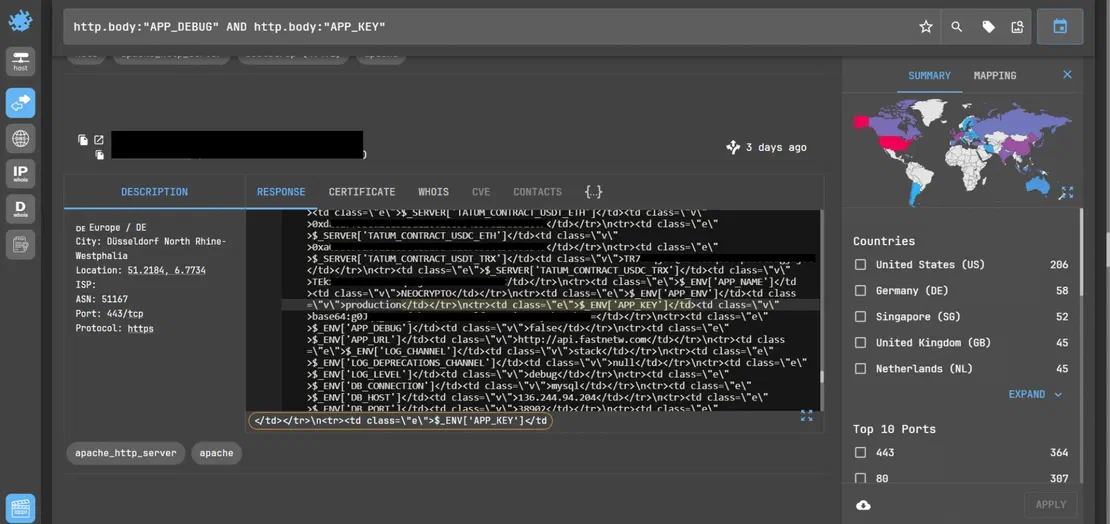
Finding 4 — Debug Dump Exposing Application Secrets, Infrastructure, and Crypto Configuration
Query used:
http.body:"APP_DEBUG" AND http.body:"APP_KEY"Another publicly accessible PHP/Symfony application was found in another search, exposing a full debug dump (VarDumper output) in its HTTP response. This dump revealed multiple sensitive components, including the application’s encryption key, backend details, and cryptocurrency-related configuration values.
$_ENV['APP_KEY']  => 'base64:g0JqQg1w***************'
$_ENV['APP_ENV']  => 'production'
$_ENV['DB_HOST']  => '136.244.x.x'
$_ENV['DB_PORT']  => '38902'

$_SERVER['TATUM_CONTRACT_USDT_ETH'] => '0xdac17f...'
$_SERVER['TATUM_CONTRACT_USDC_TRX'] => 'TR7NHq...'Risk: High.
Exposing APP_KEY is severe enough; additionally, disclosing database host details and crypto-related configuration aids attackers in infrastructure mapping and targeted exploitation of high-value systems.
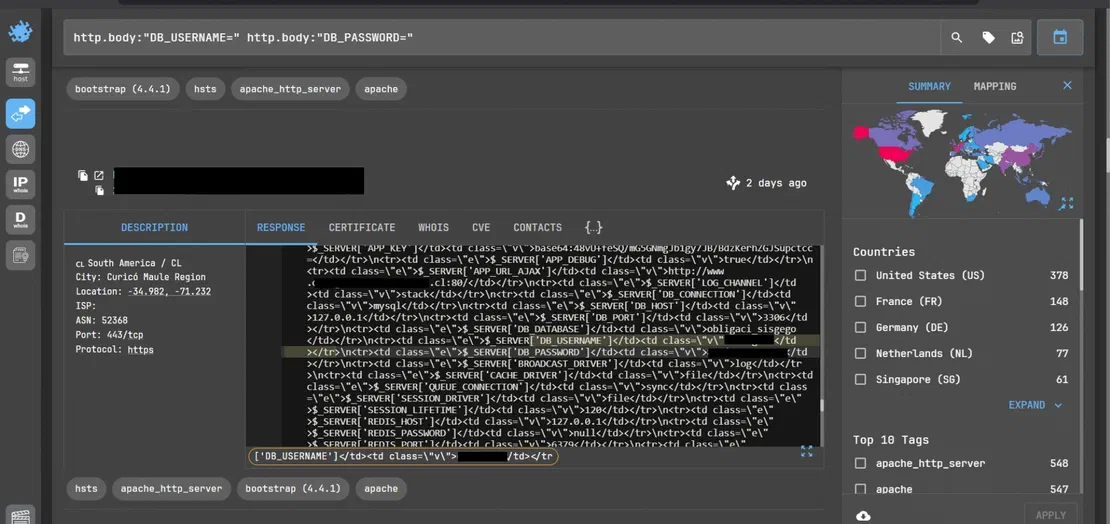
Finding 5 — Database Access Credentials Exposure via Debug Output
Query used:
http.body:"DB_USERNAME=" AND http.body:"DB_PASSWORD="

(http.body:"DB_USERNAME=" AND http.body:"DB_PASSWORD=") AND geo.country:"IN"Multiple web applications were identified exposing database access credentials in plain text. These responses mostly originate from PHP applications dumping environment variables ($_SERVER / $_ENV) directly into HTTP responses.
Case A
$_SERVER['DB_CONNECTION'] => 'mysql'
$_SERVER['DB_HOST']       => '127.0.0.1'
$_SERVER['DB_DATABASE']   => 'obligaci_sisgego'
$_SERVER['DB_USERNAME']   => 'obligaci'
$_SERVER['DB_PASSWORD'] => '**********'A PHP application exposed its environment via a debug dump, leaking the full database configuration, including username and password.
Case B
A publicly accessible application hosted in India was found exposing database access credentials in plain text. Here, we used the Geo Filter in Netlas to restrict the geolocation to India, but this can be applied to any other country as well.
(http.body:"DB_USERNAME=" http.body:"DB_PASSWORD=") AND geo.country:"IN"Exposed credentials:
$_SERVER['DB_CONNECTION'] => 'mysql'
$_SERVER['DB_HOST']       => 'localhost'
$_SERVER['DB_DATABASE']   => '[REDACTED_DB_NAME]'
$_SERVER['DB_USERNAME']   => '[REDACTED_USERNAME]'
$_SERVER['DB_PASSWORD']   => '[REDACTED_PASSWORD]'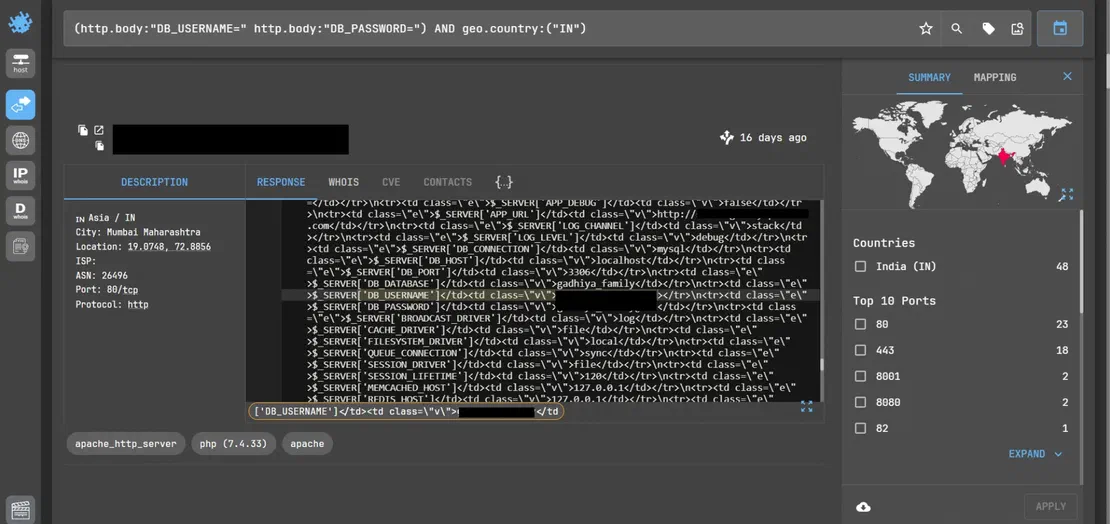
While large-scale scanning often uncovers sensitive data, not every result represents a critical security issue. In many cases, findings may simply reflect publicly exposed but intended information or low-risk artifacts that lack real exploitability.
Examples include:
- Public hostnames or service identifiers
- Frontend API keys, such as Google Maps
- Configuration values designed for client-side use
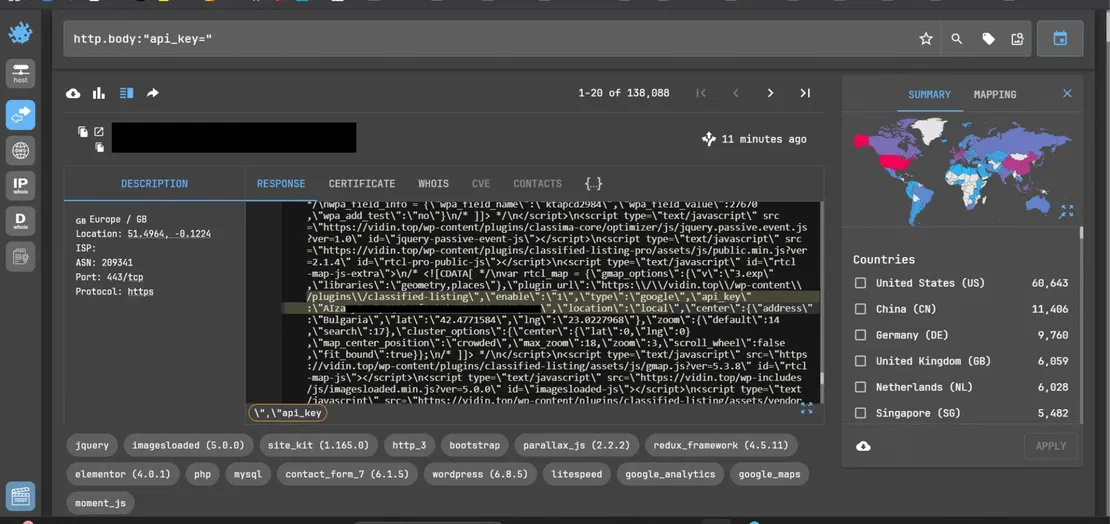
Finding — Publicly Exposed Google Maps API Key
Query used:
http.body:"api_key="A web application was found exposing a Google Maps API key within its frontend JavaScript configuration. The key is embedded in a mapping plugin and used for rendering maps, geolocation, or possibly address autocomplete features.
"api_key": "AIzaSyXXXXXXXXXXXXXXX"Such exposure is common in modern web applications. These keys are typically intended for client-side use and are often protected by usage restrictions.
Risk: Low.
- Client-side exposure is expected. Google Maps API keys are commonly embedded in frontend code.
- No direct access to backend systems, unlike database login details or application secrets.
These findings show that simple query patterns can uncover a wide range of exposed data, from critical secrets to low-risk details. Not every exposure leads to a breach, but many can give attackers a way in.
6. Security Impact of Exposed Data
Once exposed, this data does not remain a passive finding. It can directly support unauthorized access, service abuse, and multi-step attack paths that increase the overall impact of a single misconfiguration.
6.1. Credential Reuse and Unauthorized Access
When database access credentials are exposed in HTTP responses, they provide a direct path to unauthorized access, especially if the database host is reachable. In cloud setups, managed databases like AWS RDS and Alibaba RDS are often set to public during development and sometimes left open in production.
Credentials are often reused across different services in the same app stack. For example, a DB_PASSWORD that matches the MAIL_PASSWORD can put both the database and email at risk, allowing attackers to move between services.
If a full set of credentials is exposed, attackers can quickly try to log in to things like:
- Administrative panels like phpMyAdmin, cPanel, Plesk
- Email services (SMTP/IMAP)
- Remote access interfaces (SSH)
One example of credentials reuse and unauthorized access is the Colonial Pipeline ransomware attack.
6.2. API Abuse and Service Misuse
Exposed tokens and API keys, especially those in client-side code, are a real risk. They might not grant full system access, but they can still be used to abuse backend services, automate actions, and pull data at scale.
When valid tokens or API keys are exposed, attackers can:
- perform authenticated API requests outside the application
- perform automated data extraction, such as product data or user information
- bypass the owner’s frontend restrictions and interact directly with backend endpoints
- abuse service quotas, which can lead to billing impact or denial of service
Some real-life examples of API abuse and service misuse are:
Dropbox Sign Data Breach: In April 2024, attackers compromised the backend service within Dropbox and gained access to sensitive data, including API keys and OAuth tokens, which could be used to interact with internal systems and downstream services. Source
CircleCI Security Incident: In January 2023, threat actors exfiltrated many environment variables, API tokens, and keys from compromised systems. The attack was caused by malware on an engineer’s laptop that stole a 2FA-backed SSO session cookie. These tokens could then be used to access third-party services, showing how exposed secrets can grant unauthorized API access across integrated systems. Source
| Exposed Item | What an Attacker Does Next |
|---|---|
| SMTP credentials | Sends phishing emails from the victim’s real domain. These emails easily bypass most spam filters because SPF and DKIM checks pass and the email comes from a legitimate server. |
| APP_KEY (Laravel) | Uses Laravel’s Illuminate Encryption library to decrypt existing session cookies. Can then impersonate any logged-in user without knowing their password. |
| JWT Bearer token | Makes authenticated API calls directly, bypassing the frontend. For a GraphQL endpoint, this can mean reading all customer orders and personal data. |
| DB credentials (RDS) | These credentials can connect directly to the database from any internet-connected machine. They can be used to read, modify, or delete all data and can even be used by attackers to add a new admin account. |
These exposures rarely happen alone. Credentials, tokens, and config leaks often combine, creating multi-step attack paths where one leak leads to another. This makes the overall risk much higher than any single finding.
7. Case Studies of Accidental Exposure
The exposure patterns described here aren’t just worst-case scenarios. Over the past decade, there have been numerous real incidents in which attackers used credentials found in public places to launch attacks.
7.1. The Uber AWS Credential Leak (2016)
In late 2016, two attackers breached Uber’s cloud infrastructure, exfiltrating the personal data of 57 million users and drivers. The breach was not the result of a zero-day exploit, a phishing campaign, or any advanced attack technique. It happened because an AWS access key had been hardcoded into source code and stored in a GitHub repository that the attackers found. Source

| Metric | Value |
|---|---|
| Users & drivers affected | 57M |
| Fine paid to US states | $148M |
| License numbers exposed | 600K |
| Cover-up payment | $100K |
The attackers obtained the login credentials of Uber engineers from previous unrelated data breaches. At that point, Uber did not enforce MFA on GitHub, so credential stuffing against GitHub logins was enough to gain access.
Inside Uber’s private repository, the attackers searched for access keys and found an AWS access key. They then accessed an S3 bucket containing archived user and driver data.
Data Compromised
- Names, email addresses, and phone numbers of approximately 50 million riders globally
- Names, email addresses, and phone numbers of approximately 7 million drivers globally
- Driver’s license numbers of 600,000 U.S.-based drivers
The Uber breach and the findings in Section 5 share the same root cause: a credential that should have been kept private was left in a public place, waiting to be discovered.
| Aspect | Uber 2016 | This Research (Netlas) |
|---|---|---|
| What was exposed | AWS access key hardcoded in source code | DB passwords, APP_KEY, Bearer tokens in HTTP responses |
| Where it sat | Private GitHub repository | Public-facing web server HTTP response |
| Exploit required | No | No |
| Authentication needed | No (credential stuffing to enter repo) | No, anyone can query Netlas |
| Discovery method | Searching code for credentials | Searching HTTP responses via Netlas |
| Result if used | Full AWS cloud access, 57M records stolen | Full DB access, session forgery, SMTP abuse |
| Barrier to entry | Medium, needed repo access first | Low, one Netlas query is enough |
Claude Leak 2026

A more recent parallel leak occurred in March 2026, when Anthropic, the parent company of Claude, accidentally exposed 500,000 lines of Claude Code source due to a packaging misconfiguration that shipped a debug source map file in a public npm release. Unlike Uber, there was no attacker involved in this leak; the data became accessible because a build artifact intended for internal use was included in a public distribution. Source
7.2. Patterns Across Similar Incidents
Whether it’s Uber, Claude code, or other leaks, and even the findings in this blog, the same pattern appears:
- Accidental public commits: developers rush and push
.envfiles, configuration files, or hardcoded credentials to public repositories. - Debug mode in production: PHP and Python framework debug pages served in production environments have been documented as exposure vectors in multiple incident reports.
- Cloud credential exposure: as shown in Section 5, exposed AWS access keys and other cloud credentials have led to multiple public disclosures.
Platforms like Netlas, which index HTTP responses at internet scale, change the game. Exposures that once needed targeted searching are now easy to find with systematic queries.
8. Monitoring Exposure Over Time with Netlas
With Netlas, monitoring means running search queries over and over and watching for changes in the results. Instead of catching exposures the moment they happen, this method tracks when new data shows up in Netlas’s indexed data.
8.1. Manual Monitoring
The first time you run a query, it sets a baseline: a snapshot of all known exposures for a target at that moment.
Monitoring with Netlas follows a simple cycle:
Run query → Save results → Re-run → Compare → Detect changesAny change in query results may indicate that:
- a new system has become exposed
- additional data is now being leaked
- a previously identified exposure has expanded
You can use the same queries for monitoring as for discovery, but add a host filter to focus on a specific target. Now, the goal is to track changes, not just find exposures.
host:"target.com" AND http.body:"APP_KEY="
host:"target.com" AND http.body:"DB_PASSWORD="
host:"target.com" AND http.body:"Bearer eyJ"
host:"target.com" AND http.body:"Traceback"
host:"target.com" AND http.body:"Fatal error"
host:"target.com" AND http.title:"Swagger UI"
host:"target.com" AND uri:".env"You can favorite these Netlas queries to make them easy to reuse for ongoing monitoring.
8.2. Automated Monitoring Using Netlas API
Manual monitoring doesn’t work well at scale. To solve this, Netlas offers an API that lets you automate monitoring.
A typical workflow consists of:
- Running queries against a target domain.
- Storing the results as a baseline dataset.
- Scheduling periodic re-execution of the same queries.
- Comparing new results with previously stored data.
- Triggering alerts when differences are detected.
Using Netlas Private Scanner can improve this workflow further. Each private scan creates a private index that can be queried like public Netlas data, while remaining available only to its creator and teammates. Recent Netlas updates also added Private Scanner reports, which make it easier to review and compare scan results at a glance. In practice, this means monitoring can combine repeated query execution with repeated on-demand scans of specific assets, including targets that may not yet be fully represented in public indices.
Conclusion
Looking at all this research, a clear pattern stands out. Modern data exposure rarely comes from complex attacks. It usually happens because sensitive data is simply visible.
We’ve seen how sensitive data such as API keys, database credentials, debug outputs, and tokens is often exposed in HTTP responses. These exposures aren’t hidden behind tough defenses, they’re often just out in the open, waiting to be found.
The main takeaway isn’t just what gets exposed, but how easy it is to find at scale.
Development moves faster than ever. Rapid deployments, continuous integration, and quick coding make it easier to build apps, but this also leads to:
- misconfigurations being pushed directly to production
- secrets being embedded without validation
- debugging artifacts being unintentionally exposed
This is where Netlas becomes valuable. Being able to search, monitor, and understand exposures helps determine whether they become risks or remain hidden. Tools like Netlas don’t create new exposures, they just show what’s already out there. In a world where data is often exposed before anyone notices, that visibility makes all the difference.

I can show you how deep the Internet really goes
Discover exposed assets, infrastructure links, and threat surfaces across the global Internet.
Related Posts

January 20, 2025
Using Maltego with Netlas Module

April 3, 2026
Using OWASP Amass with Netlas Module

June 25, 2025
theHarvester: a Classic Open Source Intelligence Tool

August 30, 2024
Using DNS History in Cybersecurity

February 7, 2025
Using Subfinder with Netlas Module

December 27, 2024
Using theHarvester with Netlas